Becoming a grow light tester means learning to measure what a light actually delivers to your plants, not just what the box claims. You need a quantum sensor to read PPFD at canopy height, a consistent grid-based measurement method, some basic electrical and thermal awareness for safety, and a habit of writing everything down so your results mean something. You can run your first credible test today with a ~$300 handheld meter, a tape measure, and a simple spreadsheet. From there, the skill compounds fast, and there's a real path to offering this as a service to other growers.
How to Become a Grow Light Tester: Step-by-Step Guide
Marcus Tillman
27 Apr 2026
What a grow light tester actually does
A grow light tester in the home-grower world is not a lab technician or a retail product reviewer. The job is more practical than that: you're checking whether a light delivers the intensity, spectrum, and coverage that plants actually need, and whether it holds up safely over time. That means verifying that a manufacturer's PPFD claims match what you measure at the canopy, diagnosing why seedlings are stretching or leaves are bleaching, confirming that a light's footprint is reasonably uniform across a tent or shelf, and flagging when a driver or fixture is running too hot.
In plain terms, you're answering four questions every time you test a light: Is it bright enough for the plant stage? Is the light spread across the whole canopy or just the center? Is the spectrum reasonable for the grow target? And is the fixture running efficiently and safely? Those four questions cover 90% of the problems home growers actually run into.
Required skills, tools, and safety basics
Core concepts you need to understand first
You don't need a physics degree, but you do need to get comfortable with a few terms. PPFD (Photosynthetic Photon Flux Density) is measured in micromoles per square meter per second (µmol/m²/s) and tells you how many photons in the 400–700 nm range are hitting a surface per second. That's the number plants actually respond to, and it's what you'll spend most of your time measuring. DLI (Daily Light Integral) is PPFD multiplied by photoperiod hours, converted to a daily total, and it tells you whether a plant is getting enough light over a full day. Spectrum refers to the wavelength distribution of the light, which affects things like vegetative stretch, flowering response, and chlorophyll efficiency. PPE (Photosynthetic Photon Efficacy) is PPFD output per watt drawn from the wall, and it tells you how efficiently the fixture converts electricity into usable plant light.
Tools you actually need
| Tool | What it does | Budget option | Better option |
|---|---|---|---|
| Quantum sensor/meter | Measures PPFD at canopy | Apogee MQ-500 (~$340) | Apogee SQ-500 series with datalogger |
| Tape measure or ruler | Sets consistent sensor height and grid spacing | Any tape measure | Laser measure for repeatability |
| Infrared thermometer | Checks fixture surface and driver temps | ~$15–25 IR gun | Thermal camera (~$200+) |
| Kill-a-watt or smart plug with wattage readout | Measures actual wall draw | ~$20 Kill-a-Watt | Smart plug with app logging |
| Smartphone spectrometer app or basic spectrometer | Rough spectrum check | Free apps (limited accuracy) | Dedicated PAR/spectrometer (~$200+) |
| Spreadsheet (Excel or Google Sheets) | Logs and maps all measurements | Free | Free |
The Apogee MQ-500 is the standard starting point for most independent grow light testers. It covers 389–692 nm (±5 nm), has a calibration uncertainty of ±5%, repeatability under 0.5%, and long-term drift under 2% per year. Those aren't perfect numbers, but they're honest and documented, which matters when you're presenting results to others. The SQ-500 series offers similar metrology with datalogger compatibility if you want to automate readings. Either way, keep in mind that Apogee recommends sending sensors back for recalibration roughly every two years to maintain that accuracy window.
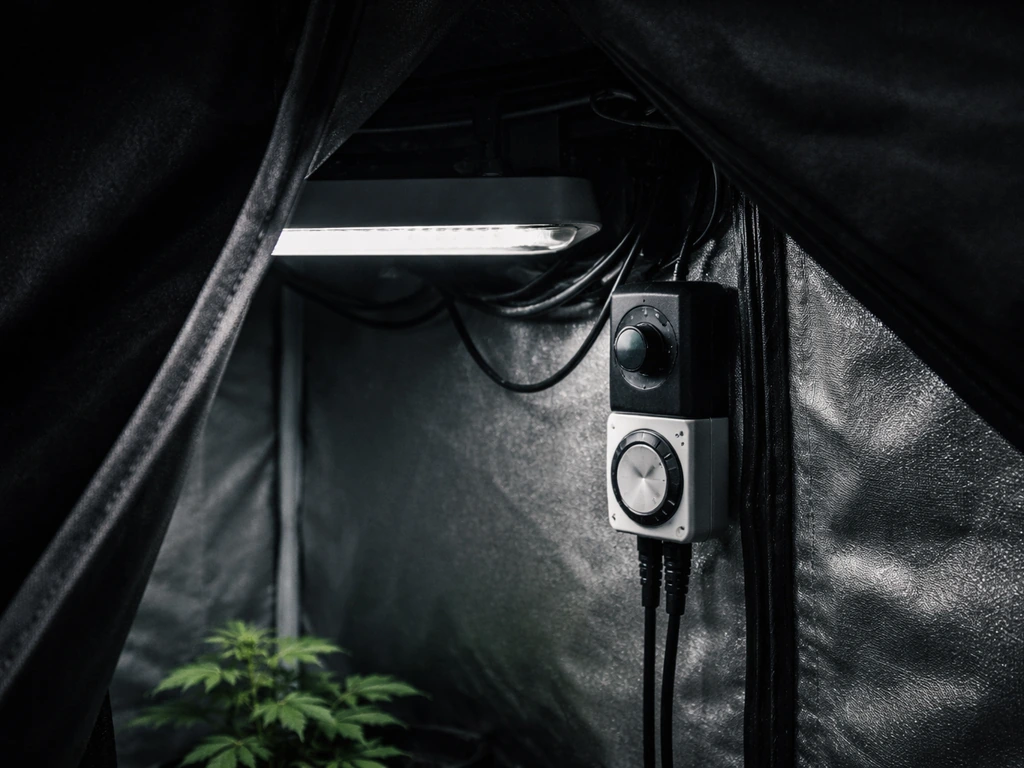
Safety before you plug anything in
Modern LED grow lights are generally safe to handle, but a few rules matter. Never look directly into a running fixture, especially high-power COB or full-spectrum LEDs that include near-UV or deep blue output. Some horticultural luminaires are tested against photobiological safety standards (IEC 62471) precisely because high-intensity LEDs can cause retinal damage with even brief direct exposure. Wear UV-blocking safety glasses when working close to any fixture that advertises UV output. Keep the sensor cable away from heat sinks and driver vents during testing. And if you're testing a fixture that's been running for a while, let it warm up to operating temperature before recording data, because output can shift as components stabilize. Always check that the electrical connection is dry and secure, and don't measure over water-saturated growing media without protecting the sensor's cable connection.
How to test for light output (PPFD, spectrum, intensity)
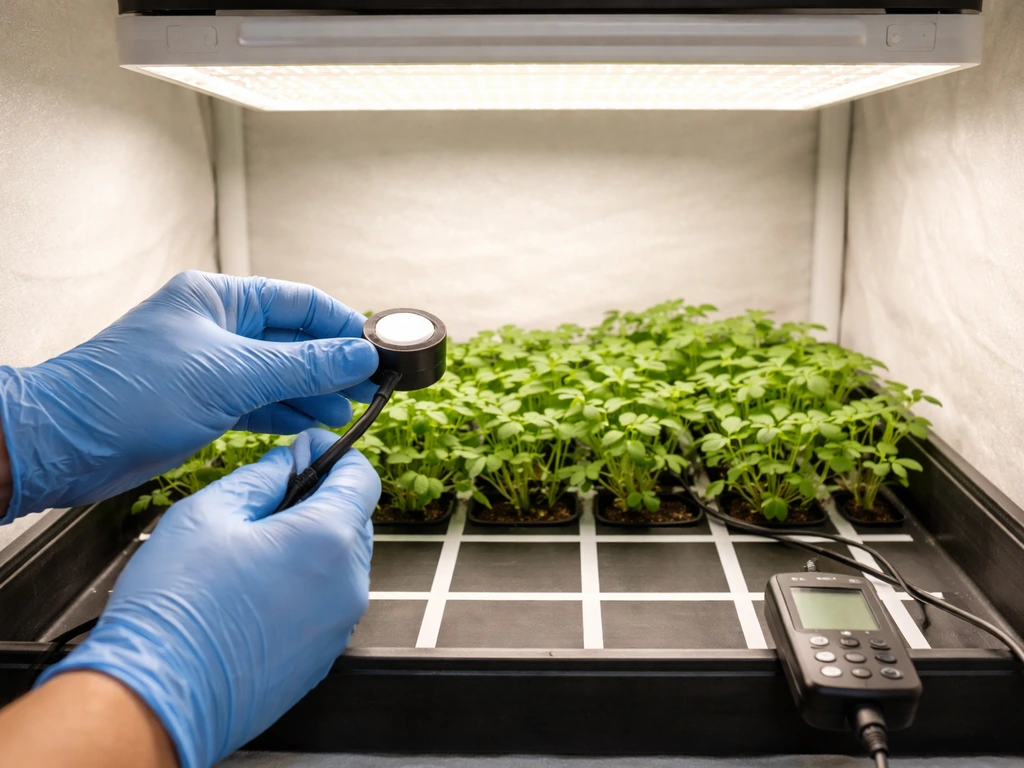
Setting up for PPFD measurement
Before you take a single reading, let the fixture warm up for at least 15–20 minutes. PPFD output changes as the driver and LEDs reach thermal equilibrium, and readings taken on a cold fixture can be noticeably higher than steady-state values. Set your sensor at the exact height you're testing (canopy height), keep it level and face-up, and make sure nothing is casting a shadow or reflecting light onto it from the side. The Apogee and Campbell sensors have a 180-degree field of view and are sensitive to cosine (angle) errors: at 75 degrees from vertical, cosine response errors can reach ±5%, so keeping the sensor flat and perpendicular to the light source matters for accuracy.
Record the ambient light conditions. If you're testing in a reflective white-lined tent, your readings will be higher than in an open room because of bounce light, and both are valid test conditions as long as you document which one you used. Testing inside the tent the grower actually uses gives more real-world-useful numbers.
Taking PPFD readings and what the numbers mean
Take readings at center (directly under the light), at the midpoint between center and edge, and at the corners or edges of the canopy footprint. For a rough check, five points work. For a proper coverage map, you want a grid, which is covered in the next section. Here's a quick reference for typical PPFD targets by plant stage:
| Plant stage | Target PPFD (µmol/m²/s) | Notes |
|---|---|---|
| Seedlings / clones | 100–300 | Too much causes bleaching and stress |
| Vegetative growth | 400–600 | Most leafy greens and veg plants thrive here |
| Flowering / fruiting | 600–900 | High-light crops like tomatoes and cannabis |
| High-intensity crops (CO2 enriched) | 900–1500+ | Only relevant with supplemental CO2 |
If a manufacturer claims 800 µmol/m²/s at 18 inches, measure at exactly 18 inches from the fixture's emitter surface. If your reading is within ±10% of that claim, the light is performing reasonably. A gap larger than that, especially if the sensor is freshly calibrated, is worth flagging. Remember the ±5% calibration uncertainty in your sensor means a reading of 760 µmol/m²/s could be anywhere from 722 to 798, so avoid making very precise pass/fail calls within that margin.
Checking spectrum without a full spectrometer
A full spectrometer gives you a wavelength-by-wavelength SPD (spectral power distribution) curve, which is the gold standard. If a manufacturer provides SPD data (actual numbers, not just a marketing graph), you can use that to evaluate spectrum quality using metrics like TM-30. For most home-level testing, you're looking for a few practical things: does the light include meaningful red (620–700 nm) and blue (400–500 nm) output for photosynthesis? Is there a reasonable white/green component for healthy chlorophyll function and visual assessment of plant color? If you're evaluating a light for flowering, does it include far-red (700–750 nm)? Smartphone spectrometer apps are rough but can tell you whether a light is heavily skewed to one color band. For anything you're going to publish or charge for, a dedicated PAR spectrometer is a worthwhile investment.
Measuring placement and coverage in real setups
Building a measurement grid
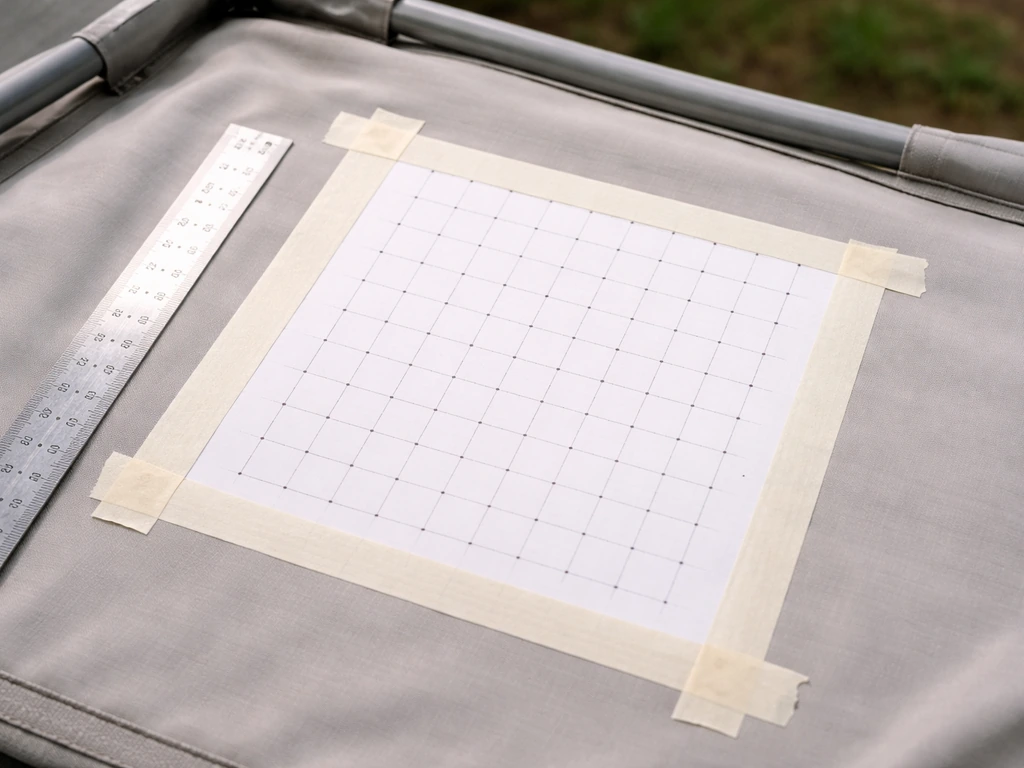
The most practical approach for a standard tent or shelf canopy is a 15 x 15 cm grid. Lay a piece of paper or tape over the canopy area and mark your grid points. For a 60 x 60 cm footprint, that gives you 16 measurement points. For a 90 x 90 cm footprint, you get 36 points. More points give a more accurate picture of uniformity, but even a 3 x 3 or 4 x 4 grid of 9–16 points tells you a lot. Take one reading per grid point, record it, and move on. Keep the sensor at a fixed, consistent height for every reading.
Once you have all the numbers, calculate the average PPFD, the minimum, and the maximum. Divide the minimum by the average: a ratio above 0.75 means reasonably uniform coverage, while anything below 0.6 means the edges are significantly underlit compared to center. That ratio is one of the most useful single numbers you can produce as a tester because it tells a grower whether they'll get uneven plant development across a bed or tray.
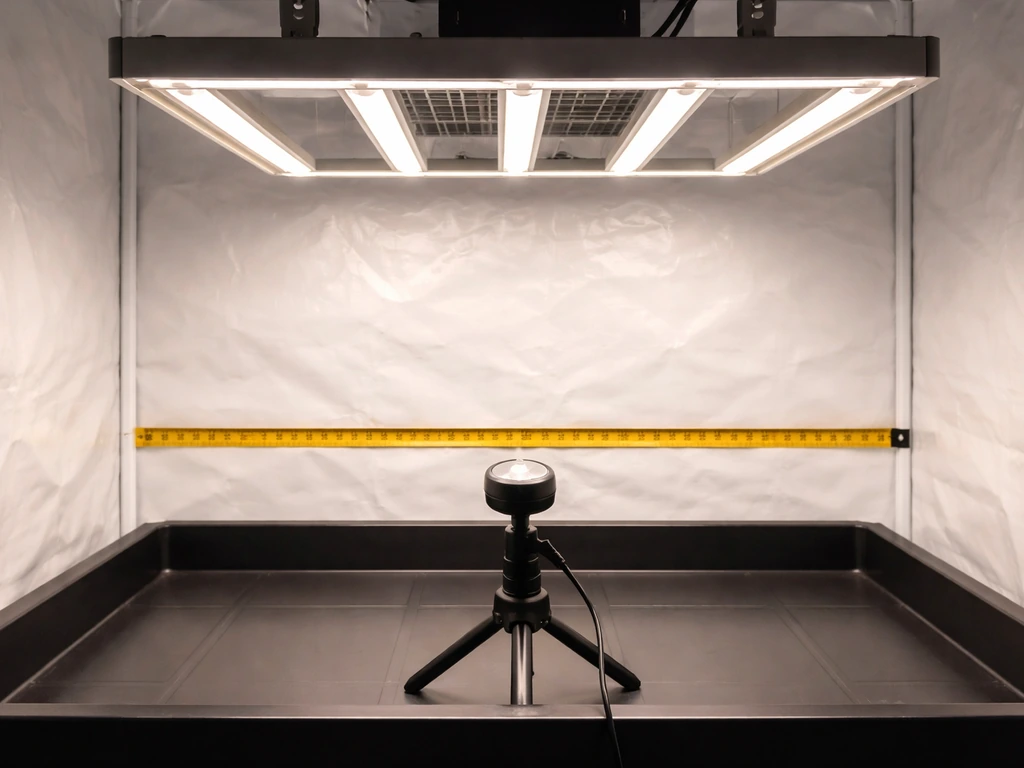
Finding the right mounting height
Raising the fixture spreads the footprint and reduces hot spots in the center. Lowering it increases intensity at the cost of uniformity. Test at three heights (the manufacturer's recommended height, 6 inches above that, and 6 inches below) and compare both the center PPFD and the min/max ratio. In most cases there's a sweet spot where center PPFD meets the target for the plant stage and the uniformity ratio is still above 0.7. That's the height to recommend. Document it specifically, because a 2-inch difference in hanging height can shift center PPFD by 15–20% with many LED bar fixtures.
Testing grow light efficiency and thermal/driver health
Calculating PPE (efficiency)
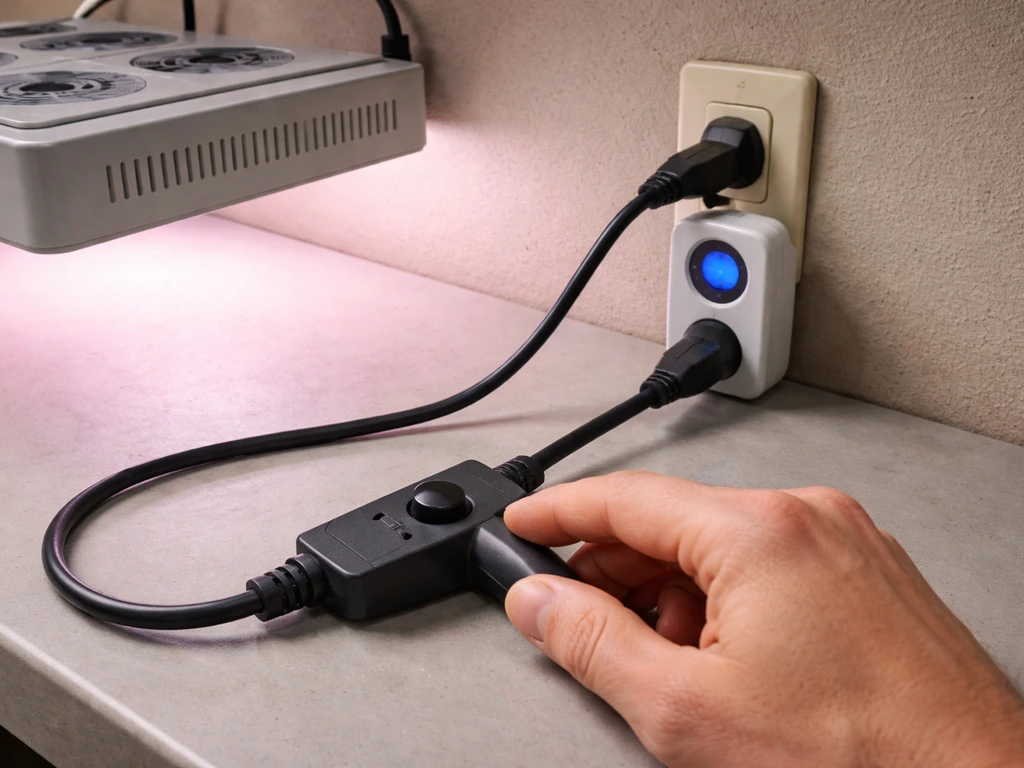
Plug the fixture into a Kill-a-Watt or similar watt meter and record true wall draw (not the manufacturer's claimed draw) at the dimmer setting you're testing. Divide your measured average PPFD by the wall watts to get a rough efficiency proxy in µmol/J. A well-designed modern LED fixture should produce somewhere between 2.5 and 3.0+ µmol/J at full power. Anything below 2.0 µmol/J is relatively inefficient for a 2025-era LED, though older fixtures or cheap panels will often fall in the 1.5–2.0 range. This number matters for growers paying electricity bills and running lights 16–18 hours a day.
Checking dimming behavior
Test PPFD at 100%, 75%, 50%, and 25% dimmer settings if the fixture has a dimmer. The PPFD should scale roughly linearly with the power draw. If a fixture claims 50% dim but the PPFD only drops by 20%, the dimmer is poorly calibrated, which matters for growers trying to manage plant stress or light schedules. Record actual watt draw at each dim level too, because some budget fixtures reduce output inconsistently.
Thermal and driver health
After the fixture has been running at full power for 30 minutes, use an IR thermometer to check the heat sink temperature and, if accessible, the driver housing. Heat sink temperatures above 60–65°C at normal ambient room temperature (around 22°C) can indicate a thermal management problem that will shorten LED lifespan. Driver housings running hot to the touch in a sealed enclosure are a reliability flag. Compare a reading at 30 minutes and 60 minutes: if the temperature is still climbing significantly between those two readings, the fixture isn't reaching a stable thermal state, which is a real concern. High operating temperatures also contribute to output degradation over time (lumen/PPFD depreciation), so a fixture that runs cooler at the same output level is genuinely better for long-term grows.
Flicker and driver stability
Flicker in grow lights is often invisible to the eye but can affect sensitive plant measurements and, in some cases, cause issues for growers filming time-lapses or working in the grow space for extended periods. High-quality drivers (Meanwell and similar) produce very low flicker. Cheap drivers can produce significant AC ripple at 100–120 Hz. You can check for obvious flicker with a slow-motion video on a smartphone: a flickering light will show bands at certain shutter speeds. For a more rigorous check, standards like IEEE 1789-2015 and IEC TR 61547-1:2020 define modulation depth and flickermeter methods, though that level of testing is beyond most home-level setups. Noting driver brand and whether visible flicker is present is a reasonable minimum.
Creating a repeatable test plan and documenting results
Credibility in testing comes from consistency. If your methodology changes between tests, your results aren't comparable and nobody can trust them. Here's a simple test plan structure that works for practical grow light testing:
- Record the fixture name, model, claimed wattage, claimed PPFD, and dimmer setting being tested.
- Note the test environment: tent or open room, reflective surfaces (yes/no), ambient temperature, and any nearby objects that could reflect or block light.
- Let the fixture warm up for 15–20 minutes before taking any readings.
- Record actual wall draw in watts using a watt meter.
- Set sensor height to the specified test distance (match the manufacturer's claim for comparison, or the intended canopy height for a real-world test).
- Take PPFD readings at every grid point (minimum 3x3, ideally 4x4 or 15x15 cm spacing for full coverage maps). Keep the sensor level and still for each reading.
- Record center PPFD, edge PPFD, min, max, and average. Calculate min/average ratio.
- Take IR thermometer readings at heat sink and driver housing at 30 and 60 minutes.
- Note dimming behavior at 100%, 75%, 50%, 25% if applicable.
- Take spectrum notes (visual color, SPD if available, any app-based rough check).
- Calculate PPE (average PPFD / wall watts).
- Write a one-paragraph conclusion: does the light meet its claimed specs, is coverage uniform, is it thermally stable, and what plant stage and footprint size is it best suited for?
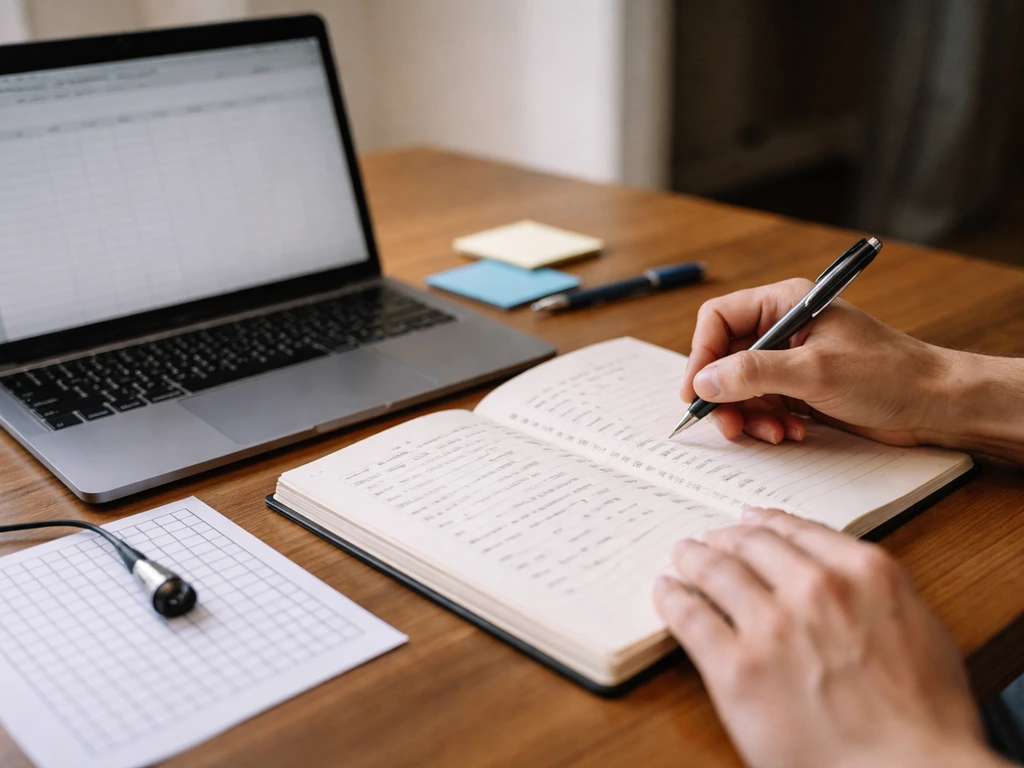
Keep every test logged in a spreadsheet with one row per fixture and one column per variable. Over time, this becomes a comparison database you can reference and share. When you report results, always include your sensor model, calibration status, and test distance so readers can evaluate the credibility of your numbers. Being upfront about the ±5% calibration uncertainty of a sensor like the MQ-500 or SQ-500 actually builds trust, not doubt, because it shows you understand your tools.
Keeping your sensor calibrated
Send your quantum sensor in for factory recalibration every two years as a baseline. Between calibrations, you can do a sanity check using Apogee's Clear Sky Calculator: on a clear day, measure outdoor PPFD at solar noon and compare it to the calculator's expected value for your location. If your reading is more than 5–7% off, it's worth considering an early recalibration. This kind of documented calibration maintenance is what separates a tester whose results growers trust from someone just waving a meter around.
Common brands, troubleshooting, and what to test in specific scenarios
"My seedlings are leggy"
Leggy seedlings almost always mean PPFD is too low at the canopy. Measure directly at the top of the seedling tray. If you're getting under 150 µmol/m²/s, the light needs to come down or the fixture is underpowered for the footprint. Also check photoperiod: 18 hours at 150 µmol/m²/s gives a DLI of about 9.7 mol/m²/day, which is on the low end for vigorous seedlings but workable. Under 6 mol/m²/day and you'll almost always see stretch. This is one of the most common problems growers bring to a tester.
"The light seems dim or weaker than when I bought it"
Take a current PPFD reading and compare it to your original baseline (or the manufacturer's spec). LEDs depreciate over time, and cheap drivers accelerate that. If output has dropped more than 10–15% from the original reading, note it. Also check whether the driver is running unusually hot, which can accelerate LED degradation. Some budget brands from platforms like Amazon use low-quality drivers that cause rapid output depreciation in the first 6–12 months. Testing a light at purchase and again after 6 months gives growers genuinely useful longevity data.
"Coverage is uneven, center plants are burning but edges are pale"
Run a full grid map. Center-heavy coverage is extremely common with cheaper LED panels that use a single central COB or tightly clustered diodes. The fix is usually raising the fixture (which drops center intensity and broadens the spread) or switching to a bar-style fixture with distributed emitters. Your grid data will show the grower exactly where the dead zones are and what mounting height improves the ratio.
Popular brands worth understanding
Mars Hydro, Spider Farmer, HLG (Horticulture Lighting Group), and Gavita are among the most commonly discussed brands in home grow communities. HLG and Gavita generally publish more detailed photometric data and use quality Meanwell drivers, making their specs easier to verify and usually more accurate. Spider Farmer and Mars Hydro have improved significantly in recent years and often represent good value, but their published PPFD maps are typically best-case scenarios measured in reflective tents at optimal height. Budget fixtures from lesser-known brands often have the largest gap between claimed and actual PPFD. Whatever brand you test, use the same methodology every time so comparisons are fair.
Building a career or side-hustle as a tester
Start with your own grow and build a portfolio
Run your test protocol on every fixture you own or can borrow. Publish the results in a consistent format: a grid map image, a summary table with center PPFD, average PPFD, min/max ratio, PPE, and thermal behavior, and a plain-language verdict. Post these in growing communities on Reddit (r/microgrowery, r/whichlight, r/IndoorGarden), Facebook groups, or a simple blog. Growers are constantly asking whether a specific light is worth buying or what went wrong with their setup. If you can answer with real data, people notice fast.
How to offer testing as a service
Once you have 5–10 published tests with documented methodology, you can start offering paid services. Options include: charging growers $30–80 to visit their setup and audit their lighting (especially useful for anyone running multiple tents or a small commercial operation), offering remote consulting where the grower sends you photos and their fixture specs while you provide a recommended PPFD map and placement guide, or partnering with local grow shops to provide independent testing data for the brands they stock. You can also approach smaller grow light brands directly: many are happy to provide pre-production or new-release units to independent testers in exchange for published results.
Communicating results so growers trust them
The difference between a hobbyist taking readings and a tester people trust is how you present uncertainty and context. Always state your sensor model and its calibration status. Always note the test environment (tent, open room, reflective or not). Say clearly what the numbers mean for plants, not just what they are. A reading of 640 µmol/m²/s at 24 inches in a 3x3 reflective tent is useful context; a reading of 640 µmol/m²/s with no other information is just a number. Growers in this niche range from complete beginners (who need the "what this means for your plants" translation) to experienced growers who want to see the raw grid data. Providing both makes your work useful to everyone.
If you're serious about this as more than a hobby, keep an eye on how the broader indoor growing world talks about lighting standards. Formal standards like ANSI/ASABE S640 define how PPFD and PPE are measured for horticultural luminaires, and UL provides testing and certification services for commercial fixtures. You don't need to reach that level for home-grower testing, but understanding those standards helps you speak credibly to more advanced growers and small commercial operators who are the natural next clients for your services. Other aspects of indoor growing, like LED grow room setup, LED scheduling, and choosing the right light type for specific plants, all connect directly to the testing work you'll be doing, so building knowledge across those areas makes you a more complete resource for the growers you work with. If you want a smooth, repeatable build, start with a proper LED grow room setup and then verify PPFD and coverage with measurements. If you're also trying to figure out how to grow weed with LED, use your PPFD and coverage measurements to dial in light distance, dimming, and schedule for the plant stage. If you're trying to adapt non-standard fixtures, like regular LED shop lights instead of dedicated horticultural LEDs, pair this testing approach with a practical guide on how to use normal led lights as grow lights so you can dial in distance, spectrum, and PPFD correctly. If you want to apply these PPFD and coverage results to a specific crop, use a guide on how to grow light dep to set the right light distance, schedule, and target DLI. Once you know what a light actually delivers, you can also explore legitimate ways to get free or discounted LED grow lights and compare them with your measurements LED grow light testing work you'll be doing. Once you know what a light actually delivers, you can also explore legitimate ways to get free or discounted LED grow lights, including how to get grow lights once human, and compare them with your measurements.
FAQ
Can I test grow lights accurately if I only own a PPFD meter and no spectrometer?
If you only have a PPFD (quantum) meter, you can still do useful testing, but you cannot fully characterize spectrum quality. Use PPFD for intensity, coverage uniformity, and dimmer linearity, then evaluate spectrum indirectly by checking whether the fixture includes key bands for your crop (red, blue, and possibly far-red) using the manufacturer’s SPD or a basic phone spectrometer as a sanity check. If you plan to publish results or compare “veg vs flower” claims, get a PAR spectrometer later, since PPFD alone cannot confirm spectral balance.
How do I know when a light is fully warmed up for repeatable PPFD readings?
Plan for a “fresh warm-up baseline” every session. For example, start each dimmer setting after the fixture warms for the same duration (15 to 20 minutes as you do now), then re-check center PPFD one time after an additional 10 to 15 minutes. If the second center reading shifts more than about 5%, you should treat the earlier readings as preliminary and note thermal stabilization behavior.
What should I do if the light is mounted over trays, netting, or other obstructions during testing?
Avoid measuring when plant material, plastic covers, or hanging hardware are between the sensor and LEDs. If you must test in a real setup with obstacles (trellis wires, reflective film, netting), you should test with the same obstructions the grower will use, because PPFD loss from diffusion and spacing can be significant. Document exactly what is in the light path, otherwise two testers can get different numbers even with the same sensor.
In a grow tent, should I measure at a fixed distance from the light or at true canopy height?
Don’t confuse “canopy height” with “distance from the fixture.” Measure PPFD with the sensor at the actual target surface location (top of seedlings or the canopy reference) and keep that reference consistent across heights. If the grower has plants at different stages or different canopy geometries, you may need separate grid maps at each stage so recommendations are not based on a misleading height definition.
Is it a problem if my tent is more reflective than the grower’s space?
Yes, but be consistent and recognize that reflected light can inflate results. If you test in a reflective tent, note that the reading represents “light reaching the canopy plus bounced light.” For comparisons between fixtures, use the same tent material, same line-of-sight conditions, and the same grid procedure. If you want a more conservative number, test once in a darker, less reflective environment (open room or black interior) and report both scenarios.
How can I reduce angle and “cosine error” mistakes when moving the sensor around a grid?
Cosine response error matters most when the sensor tilts. If you want to verify your procedure, pick a fixed grid point, then intentionally tilt the sensor a few degrees and confirm the reading changes in the expected direction. In practice, use a level indicator, keep the sensor face parallel to the light direction (perpendicular to the incoming light), and re-seat the sensor the same way at every point.
What’s the best way to test whether a light’s dimmer actually scales PPFD linearly?
Do a dimmer sanity check by confirming both PPFD and watts at each dim level, and watch for nonlinearity at low power. A common mistake is assuming 25% dim equals roughly 25% PPFD. If PPFD does not track watts, it can mean driver behavior changes (regulation mode shifts), and that affects plant stress and scheduling outcomes.
How do I avoid mixing up “true wall draw” with something misleading when efficiency (µmol/J) looks wrong?
To catch wiring or measurement mistakes, record the Kill-a-Watt reading at the same outlet and with the same dimmer setting you used for PPFD. Then compare expected efficiency trends, for example whether µmol/J at 100% is in a plausible range for the fixture class. Large inconsistencies often come from measuring at the wrong dimmer knob position, using different power strips, or testing at a different wall voltage than previous runs.
Should I report grid density along with the uniformity ratio (min/average)?
If you publish min, max, and ratio, also publish the grid size and grid spacing. A 0.75 ratio computed from a 3 by 3 grid can look very different from a 6 by 6 or finer grid, because small dead zones may be missed. Reporting the number of points helps readers judge how robust the uniformity conclusion is for their actual canopy.
How can I verify that my testing method is still consistent over months, not just per fixture?
Yes, especially for long-term credibility. A practical approach is to define a “control fixture” you own or can borrow, then retest it on a monthly basis with the same sensor and setup. If your control results drift beyond your normal variance, you can flag sensor drift or procedural changes before trusting new fixtures.
If plants look stressed, how do I decide whether to adjust intensity, height, or photoperiod?
If you see leggy or bleaching symptoms, test for PPFD at the top of the plant, but also check DLI and exposure schedule. Many growers diagnose “too much light” based on bleaching, when the real cause is overexposure in a short photoperiod peak or a spectrum mismatch. Use PPFD and photoperiod together to estimate DLI at the canopy, then adjust both intensity and schedule rather than only hanging height.
Next Article
How to Grow Light Dep Indoors Step-by-Step Guide
Step-by-step indoor light dep setup to control the dark period, trigger flowering, and troubleshoot common timing and li